
FPL Fixture Difficulty Ratings
Fixture Difficulty Ratings (FDR) for players and teams in the Fantasy Premier League (FPL) game. The fixture difficulty ratings calculated by FPL themselves do not differentiate by position, or even between attack and defence. But a team may both score a lot of goals and concede a lot of goals, or conversely may be poor in attack and great in defence.
My fixture difficulty ratings are calculated by individual position, so they are more specific and granular than the fixture difficulty ratings calculated by FPL, and therefore more useful in identifying opponents to target when choosing players for your FPL team. The figures are updated hourly. Explanations of the columns:
- Expected FPL Points By Typical Opposition Players: How many FPL points a typical player in each FPL position is currently expected to score against this team. Higher numbers / green shading indicate opposition teams to target. Lower numbers / pink shading indicate opponents to avoid. The calculations are mainly based on the number of FPL points conceded to opposition players in the current and last seasons, sometimes referred to as "FPA" (FPL Points Against). The algorithm also takes expected goals (xG) and expected assists (xA) into account. More weight is given to recent team performances. I use these metrics, along with individual player merit, in calculating predicted FPL points for each player for each fixture.
- Scoriness: How many goals this team is currently expected to score against a typical EPL team, based on a combination of actual goals scored and expected goals (xG).
- Porosity: How many goals this team is currently expected to concede against a typical EPL team, based on a combination of actual goals against and expected goals against (xGA). Higher numbers indicate teams to target. I use scoriness and porosity together to calculate predicted EPL team goals per FPL gameweek.
| Team | Expected FPL points by typical opposition players | Scoriness | Porosity | |||||||||
|---|---|---|---|---|---|---|---|---|---|---|---|---|
| Goalkeepers | Defenders | Midfielders | Forwards | |||||||||
| Hm | Aw | Hm | Aw | Hm | Aw | Hm | Aw | Hm | Aw | Hm | Aw | Arsenal | 2.97 | 2.47 | 1.74 | 2.13 | 2.08 | 2.33 | 2.16 | 2.30 | 2.22 | 1.89 | 0.93 | 0.92 | Aston Villa | 2.62 | 2.91 | 2.20 | 2.54 | 2.46 | 2.61 | 2.72 | 3.23 | 1.84 | 1.34 | 1.33 | 1.48 | Bournemouth | 3.22 | 3.08 | 2.41 | 2.77 | 2.61 | 3.20 | 2.69 | 2.88 | 1.35 | 1.23 | 1.43 | 1.83 | Brentford | 2.93 | 2.84 | 2.37 | 2.85 | 2.65 | 2.94 | 2.78 | 2.73 | 1.59 | 1.22 | 1.32 | 1.59 | Brighton | 3.35 | 3.30 | 2.13 | 2.17 | 2.50 | 2.74 | 2.68 | 2.86 | 1.71 | 1.38 | 1.22 | 1.55 | Burnley | 3.38 | 3.54 | 2.94 | 3.49 | 2.70 | 3.21 | 2.71 | 3.70 | 1.08 | 0.88 | 1.56 | 1.80 | Chelsea | 2.98 | 3.61 | 1.91 | 2.61 | 2.54 | 2.88 | 3.21 | 3.18 | 1.95 | 1.45 | 1.26 | 1.58 | Crystal Palace | 3.41 | 3.89 | 2.85 | 3.40 | 2.60 | 3.02 | 2.67 | 3.00 | 1.33 | 0.96 | 1.26 | 1.59 | Everton | 4.25 | 3.75 | 2.45 | 3.17 | 2.70 | 3.27 | 3.25 | 3.63 | 1.30 | 1.04 | 1.26 | 1.84 | Fulham | 3.26 | 4.17 | 2.70 | 2.98 | 2.72 | 3.19 | 3.59 | 3.94 | 1.58 | 1.17 | 1.33 | 1.74 | Liverpool | 3.63 | 3.04 | 1.67 | 2.26 | 2.30 | 2.82 | 2.52 | 2.90 | 2.44 | 1.85 | 0.89 | 1.26 | Luton | 3.40 | 3.24 | 2.35 | 3.44 | 2.87 | 3.15 | 3.45 | 4.34 | 1.13 | 0.88 | 1.29 | 1.96 | Man City | 2.21 | 3.34 | 1.47 | 1.73 | 1.97 | 2.30 | 2.32 | 2.46 | 2.44 | 2.02 | 0.75 | 1.01 | Man Utd | 3.49 | 3.38 | 2.24 | 2.73 | 2.65 | 3.03 | 2.51 | 3.07 | 1.72 | 1.32 | 1.27 | 1.75 | Newcastle | 2.37 | 2.95 | 1.59 | 2.83 | 2.34 | 3.10 | 3.01 | 3.21 | 2.24 | 1.42 | 1.12 | 1.73 | Nottm Forest | 3.28 | 3.72 | 2.69 | 2.79 | 2.75 | 3.05 | 2.75 | 3.85 | 1.47 | 1.08 | 1.27 | 1.94 | Sheffield Utd | 3.34 | 3.71 | 2.70 | 3.36 | 3.03 | 3.07 | 3.15 | 3.24 | 0.94 | 0.64 | 1.78 | 1.58 | Spurs | 2.93 | 2.72 | 1.87 | 2.31 | 2.42 | 2.73 | 2.97 | 3.47 | 1.92 | 1.55 | 1.25 | 1.73 | West Ham | 2.75 | 3.54 | 2.27 | 2.60 | 2.59 | 2.99 | 3.06 | 3.48 | 1.39 | 1.30 | 1.40 | 1.86 | Wolves | 3.24 | 3.02 | 2.58 | 2.79 | 2.66 | 2.85 | 2.92 | 2.91 | 1.27 | 1.07 | 1.36 | 1.72 |
| Team | Hm | Aw | Hm | Aw | Hm | Aw | Hm | Aw | Hm | Aw | Hm | Aw |
Team Form & FPL Point Vulnerability
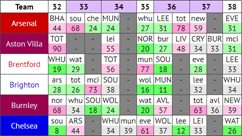
This ticker table shows the FPL points predicted to be scored by the opposition teams' players across all positions in each future fixture. For past matches, the actual FPL points scored by the opposition are shown. Far more useful for FPL than simply looking at a summary of recent wins/draws/losses or goals scored/conceded for each team.
Team Form & FPL Point Vulnerability...
Fixture Difficulty Tickers By Position
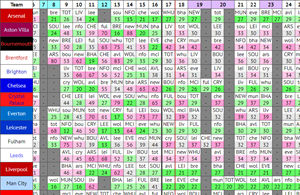
These 4 ticker tables show the FPL points predicted to be scored by a typical opposition player in each position in each future fixture. For past matches, the actual FPL points scored per player in each position are shown.
Fixture Difficulty Ticker for FPL Goalkeepers...
Fixture Difficulty Ticker for FPL Defenders...
Fixture Difficulty Ticker for FPL Midfielders...
Fixture Difficulty Ticker for FPL Forwards...