FPL Form Help
How to use the tools on FPL Form for optimizing your Fantasy Premier League team.
- Introduction
- FPL Player Predicted Points (PP) and Value
- FPL Transfer Suggestors
- Player Information Popups
- Predicted Team Goals
- Season Tickers
- FPL Player Data
- FPL Form on Mobile
Introduction
FPL Form is a website designed to help you choose which players to transfer in and out of your Fantasy Premier League (FPL) team, when to transfer them, and which players to play in your team, captain, or sit on your bench. Past statistics are used in optimized algorithms to predict future performance. The ultimate aim is to maximize your FPL points so you can win your mini-leagues and achieve a high overall rank.
FPL Player Predicted Points (PP) and Value
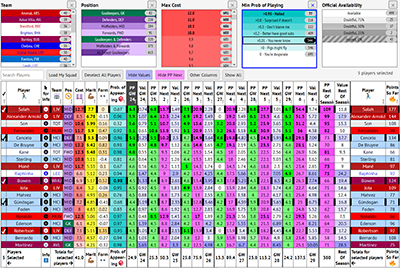
 The FPL Player Predicted Points (PP) and Value page is an interactive table that shows predicted points (PP) for each player for up to the next 6 gameweeks and the rest of the season, along with various other information.
There is a lot of information on the page, so there will be some delay when it is first opened. This is normal. Please be patient. Once the data has been loaded, a lot of information and power is available without having to reload the page.
If things go weird at any point, reload the page. If things are still weird then hold the CTRL key (CMD on a Mac) and press F5 to do a hard reset, which refreshes the cache. See below for instructions on clearing the cache on mobile.
Scrolling
When scrolling the table vertically, the column headers and footers should "stick" to the top and bottom of the screen and always be visible.
Zooming
Zooming out can be particularly useful on this page, because the table is so large. Besides your browser's View menu, you can press the [-] key while holding CTRL to zoom out and see more players, the [+] key while holding CTRL to zoom in, and the [0] key while holding CTRL to reset to 100%.You cannot zoom this page on a phone or tablet because the "sticky" table header and footer prevent it, but scrolling works pretty well.
Single Column Sorting
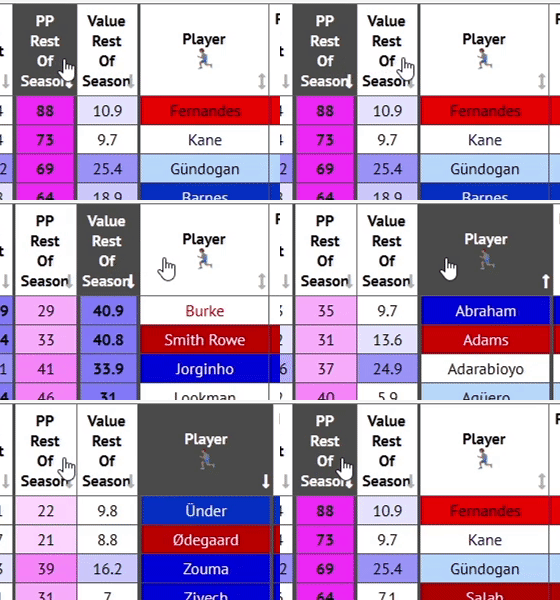
The table's rows can be sorted by the data in a column by clicking on the column header. A arrow means a column can be sorted in both directions (descending/ascending), a arrow means it can be sorted by descending values only, and a arrow means it can be sorted by ascending values only. The column(s) currently used for sorting are highlighted in dark grey. By default, the table loads with rows sorted descendingly by the players' predicted points for the next gameweek.
Multiple Column Sorting
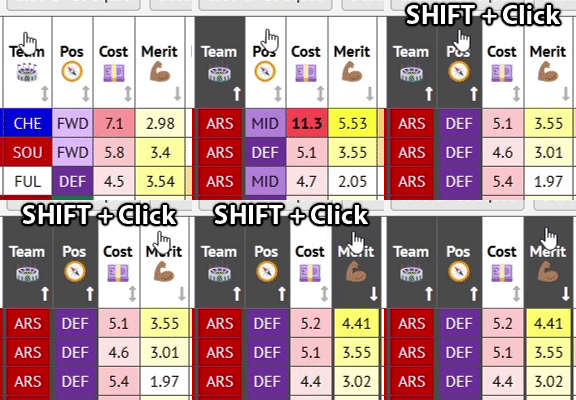
To sort by multiple columns, click a column header to sort by its values, then hold the SHIFT key while clicking further column headers to sort secondarily by the values in those columns. For example, you could sort by Cost, then hold down the SHIFT key and click PP Rest Of Season to order the players by their predicted points for the rest of the season, within each price point. Or you could rank each team's players by position and predicted points for the next 6 gameweeks by clicking the Team column header, then hold SHIFT and click Pos then PP Next 6. Click any other column header to clear the multiple column sorting.
Alternatively, if you click a column to sort by its values without holding SHIFT, the secondary sorting will be by the column previously sorted by. It's really useful that the "existing" sorting is not forgotten. For example, you might click PP Next 3 to sort by predicted points for the next 3 gameweeks, then click the ✔ at the top of the first column to sort by selected players (see Selecting Players). This quickly ranks your own players (and any you have manually selected) at the top of the table.
Column Reordering
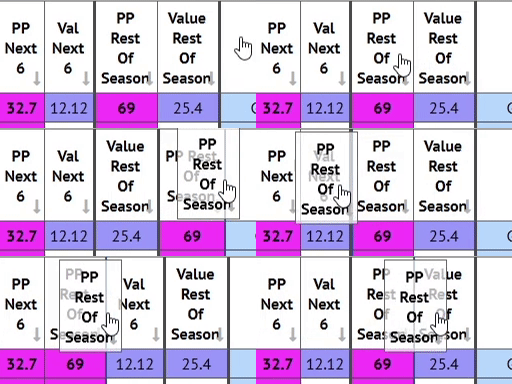
Columns can be reordered by dragging the column header left or right. Useful for small displays, or where you're only concerned about a couple of columns. For example you might drag PP Rest Of Season column all the way to the left, before the individual gameweek PP columns.
Column Visibility
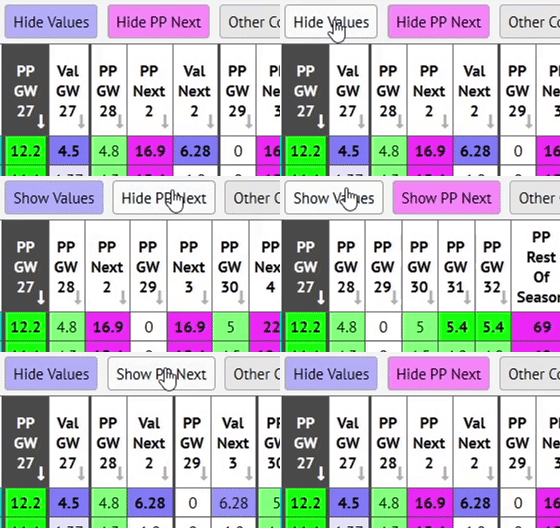
Most columns can be hidden, which is useful for smaller displays, or just to "declutter" by hiding the columns you're not interested in. To hide all the value columns, click the blue Hide Values button. To hide all the PP Next XX columns, click the pink Hide PP Next button. The button text changes to Show.... Click it again to restore visibility.
To hide other columns, click the Other Columns button and click the colums that you want to hide (so that the button turns darker grey). Click outside the Other Columns menu to dismiss it.
Click the Show All button to show all columns.
Note that, currently, all columns will be visible and in the original order again if you refresh the page.
Column Definitions

Many of the column headers in the table show tooltips when you hover over them, as seen in this screenshot.Below is a summary of each column.
- ✔ - Whether the player is selected in the table or not. See Selecting Players, below.
- Player - Self-explanatory. All the players in the FPL game are loaded, but some may not be shown due to filters being set.
- for info - Click the symbol in a player's row to launch a big popup window containing detailed information about that player. See Player Information Popups below.
- Team - The 3-letter team code used by the FPL game.
- Pos - The position that the player has been assigned by the FPL game. GK: Goalkeeper, DEF: Defender, MID: Midfielder, FWD: Forward.
- Cost - The current price to buy the player. Prices change each night (UK time). FPL Form updates every hour.
- Merit - This is my measure of how good a player currently is, in terms of their likelihood to score FPL points. This is calculated by a complex algorithm that looks at each player's FPL points, xG, xA and absenteeism over this season and last season. It gives more weight to recent performance. This merit is combined with the opposition's merit (scoriness/porosity), to calculate FPL points predictions for each player.
- Form - This is a measure of whether a player has under or over-performed (i.e. scored more or fewer FPL points) over his last 4 fixtures, compared to my predictions for that player ("Recent Under/Over-Performance" was too long to fit in the box). This is different from the FPL game's own "form", which is the player's average score per match, calculated from all matches played by his club in the last 30 days.
- Prob. Of Appearing - The player's probability of playing at all (not just starting) in the next fixture, based on how often he appeared in the recent past when available to play. Players with a POA close to 1.0 are very likely to appear. Players with a POA close to 0 are unlikely to appear. In exceptional circumstances I temporarily reduce high probabilities manually until the algorithm takes over naturally. For example if a player has been standing in for injured players who are now returning (e.g. Nat Phillips 2021) or moves to a club where they are less likely to play than before (e.g. Lingard returning from West Ham to Man Utd in 2021).
- PP GW XX - Predicted Points. This is the number of FPL points that the player is predicted to score in a gameweek. Sometimes referred to by others as "xP". These are based on a combination of the player's merit (described above) and the opposition's attacking strength/defensive weakness.
- Specifically, the algorithm calculates team vulnerability to FPL points in the player's position (termed "Expected FPL points by typical opposition players" on my FPL Fixture Difficulty page) based on past FPL points conceded to players in that position.
- For goalkeepers & defenders, the algorithm also considers the opposition's "scoriness" (calculated from past team expected-goals (xG) and actual goals scored).
- For midfielders & forwards, the algorithm also considers the opposition's "porosity" (calculated from past team expected-goals-against (xGA) and actual goals conceded).
- In short, xG/xGA refer to how many goals a player or team should have scored/conceded based on their performance, as opposed to the number they actually scored/conceded.
- All metrics have a recency weighting, and all weightings are continuously optimized as the season progresses.
- The algorithm continually optimizes itself to minimize the difference between PP and the actual FPL points scored. It inevitably has the highest chance of accuracy for the forthcoming gameweek. It currently assumes that each player's merit and each team's metrics will continue at their current levels for the rest of the season.
- Note that PP in this table does not take into account the player's probability of appearing (e.g. If a player has a probability of appearing of 0.5, I do not divide his PP by 2). PP assumes that doubtful players with 25-75% chance of playing will be fit to play. You could think of PP as 'IAxP' (If-Appears Expected Points). So it's up to you to make the judgement over whether the player will play or not. However if a player definitely cannot play (transferred, loaned out, suspended or injured with 0% chance of playing), the predicted points is set to zero. Don't blame me if Mourinho tells the press that Kane is crocked for a month then plays him 2 days later! Probability of playing can be taken into account in my FPL Transfer Suggestors.
- As soon as the transfer deadline has passed, the table updates to only show future gameweeks.
- Val GW XX - The player's value for the gameweek in terms of predicted points per million pounds "excess" cost. The deeper blue the shading is, the better value the player is. Good value players can be quickly spotted by scanning the table for deep blue rows. Instead of 0, a base cost of £3m for goalkeepers & defenders, and £3.5m for midfielders & forwards is subtracted from the player's price. Using this excess cost gives a better comparison of true value than using a base of 0. I did not use the game's most minimum prices as the base cost because this highlights too many very cheap players, and gives an infinite value to players priced at that minimum cost.
- PP Next X - The player's predicted points for the next X gameweeks. This is simply a sum of each week's PP, and allows you to compare players' predicted returns over a timescale of 2-6 future gameweeks.
- Val Next X - The player's predicted value for the next X gameweeks. This is the "PP Next X" figure divided by the player's excess cost.
- PP Rest Of Season - The player's total predicted points for the remaining gameweeks of the season.
- Value Rest Of Season - The player's predicted value over the remaining gameweeks of the season.

- Points So Far - The number of FPL points that the player has scored so far this season.
- Official Chance - The player's official percentage chance of playing given in the FPL game. See my FPL Resources page for better sources of injury updates.
- Official Availability - The player's official availability given in the FPL game. Possible values:
- Available players have normal shading by their team.

- Doubtful players are shaded with thin horizontal lines.

- Injured and suspended players have thick diagonal cross-hatching.

- Unavailable and loaned-out players are grey.

- Available players have normal shading by their team.
- Selected By % - The percentage of FPL managers that have selected the player in their squad.
- Transfers In GW - The number of times the player has been transferred in during the current gameweek. Useful for seeing what the crowd is doing.
- Transfers Out GW - The number of times the player has been transferred out during the current gameweek.
- News - FPL official news about the player. Usually this concerns availability issues such as injuries, suspensions, transfers and loans.
Filtering Players Shown
The players shown in the table can be filtered by various categories using the filters panel at the top of the page, to limit the players shown to only the ones that interest you. Filters can be selected from more than one category.

To select multiple filters in one filter category, hold SHIFT or CTRL while clicking them. For example, to show only players from Arsenal and Aston Villa, hold SHIFT then click Arsenal, then click Aston Villa, then release SHIFT.
To deselect a selected filter, click it again. To deselect all filters in one category, click the "X" button above the filter list. To deselect all filters in all categories, click the Clear All button at the top right, which also clears the "Search Players" box.
The number of active (currently selected) filters is shown at the top left of the page.
The number shown in the elliptical box next to the filter description is the number of players that satisfy that individual filter.
Filters Available
- Team - The player's team.
- Position - The position that the player has been assigned by the FPL game. GK: Goalkeeper, DEF: Defender, MID: Midfielder, FWD: Forward. 3 combinations of positions may be selected by a single click (so that SHIFT clicking is not necessary): Goalkeepers & Defenders, Midfielders & Forwards, and All Except Goalkeepers.
- Max Cost - The maximum cost of players. Very useful when searching for the best player within a limited budget.
- Min Prob of Appearing - The minimum probability of the player appearing. By default this is set to >0.01 - You never know, which excludes players that are highly unlikely to appear.
- Official Availability - The player's official availability given in the FPL game. This selects a discrete value, not a minimum availability.
Searching Players
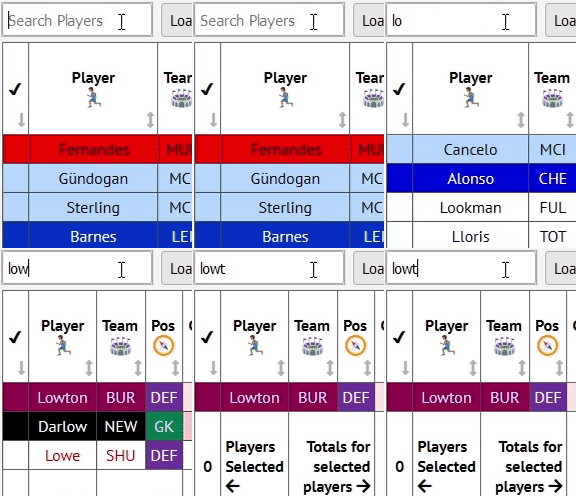
Specific players can be found by using the search box on the left of the page. Only rows containing text that matches what you type will be shown.
Selecting Players
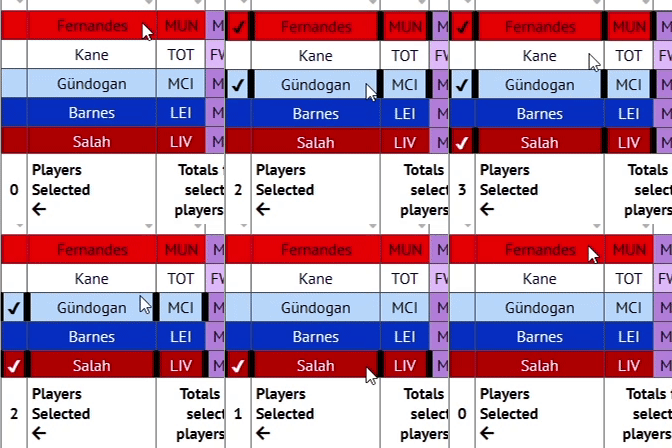
You can select players to view predictions for a group of players, or just to highlight them.
To select players, simply click any cell in the player's row except for the cell. The edges of the cells in the player's row are thickened and a ✔ is shown in the first column.
To deselect a player, click any cell in the player's row again (except for the cell). To deselect all players, click the Deselect All Players button above the table.
The total cost and total predicted points of the selected players are shown in the table footer.
The number of selected players is shown at the bottom of the first column, and also above the table at the right. Your squad should have 15 players (2 goalkeepers, 5 defenders, 5 midfielders, 3 forwards).
Selected players can be shown together at the top of the table by sorting by the first column (by clicking the ✔ in the column header). You should use this a lot!
Loading Your FPL Squad
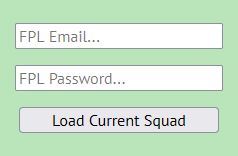 To fetch your current players and their selling prices, select the Load My Squad button above the table. If your squad is already loaded in your browser, any currently selected players will be deselected and your players will be selected. If your squad has not already been loaded in the browser, you will be taken to the Load My FPL Squad page. After entering your email and password, the predictions page will reload and your current players will be selected.
I do not store your email address or password, and I never attempt to make transfers or play chips for you. Your browser may store your email address or password locally on your device, if you permit it. Your squad is "remembered" across pages (stored in your browser) until you close your browser, or another manager's squad is loaded, or you choose "Unload..." from the squad menu at the top right.
Example Usage - Choosing captain and bench
To help you decide which of your players to captain, which to play, and which to bench:
- Load your current squad as described above. Players are initially ranked by predicted points for the next gameweek.
- Bring the selected players to the top of the table by clicking the ✔ at the top of the first column.
- Captain candidates should be at the top, while bench candidates should be at the bottom.
Example Usage - Compare total predicted points for 2 sets of players
To compare future points predictions for 2 alternative sets of players:
- Select a set of players that you want to compare, for example a starting team of 11 players, checking the total cost at the bottom of the Cost column.
- Open the same page in a 2nd browser or browser tab and select another set of the same number and position of players with similar total cost.
- Compare the total predicted points of each squad across various timescales by looking at the figures in the table footer.
FPL Transfer Suggestors
My transfer suggestors help you choose the best transfer(s) for your team in order to maximize future points. Depending on how many transfers you wish to make, choose either my Single DPL Transfer Suggestor or Double FPL Transfer Suggestor.
Settings

First gameweek to consider - Here you choose the first gameweek to include in the calculations. This defaults to the next gameweek, but you can choose a future gameweek if you wish to plan ahead.
Number of gameweeks to consider - Here you choose how many gameweeks to include in the calculations. This defaults to 6, but you may want to take a shorter view by choosing a smaller number, or a long-term view by choosing "Rest of season".
Cash to leave in the bank - Here you set how much cash you wish to leave in the bank after your transfer(s). It defaults to 0. You may wish to set a higher number to keep some cash in reserve, but that may hide some potentially very attractive transfer suggestions. Personally I never set this above 0 so I can see more options.
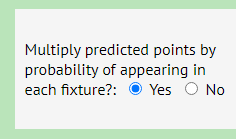 Multiply predicted points by probability of appearing in each fixture? - If you choose Yes, the predicted points of players less likely to appear will be reduced compared to those more likely to appear. If you want more nailed-on players, or don't pay FPL much attention, choose Yes. Note that, for the Single Transfer Suggestor, the Prob. of Appearing column is only for the next fixture, but the probabilities of appearing in future fixtures are included in the calculations. If you choose No, the predicted points do not take the player's probability of appearing into account (unless they are completely unavailable). Players with a low probability of appearing will be suggested and there is more onus on you to decide if players will appear or not.
 Exclude replacements below this probability of appearing in the next fixture - Here you can choose to only suggest players above a certain probability of playing (between 0 and 1) in the next fixture. This may be useful if you are only looking for players who are likely to start, but note that if you increase the figure from 0, you may exclude cheap enablers. e.g. In a double transfer, Holding may only have a 0.5 probability of playing, but at just 4.3 million he can sit on the bench and may free up just enough funds to enable you to sign Salah.
 Players To Keep - Here you can select players to exclude from the transfer suggestions (and therefore keep). By default, all your current substitutes except your 1st outfield subtitute are selected. If you deselect everyone, expect your substitutes to dominate your top suggestions. Please let me know if you think I should change this to pre-select no players, or perhaps just your 2nd goalkeeper.
Suggestions Table
All suggestions are ranked by predicted FPL points gain. Transfers are only suggested if you are able to make them, in terms of budget or number of players per club. If you already have 3 players from one club, further players from that club will only be suggested as replacements for those players, and not as replacements for players from other clubs.
Single FPL Transfer Suggestor:
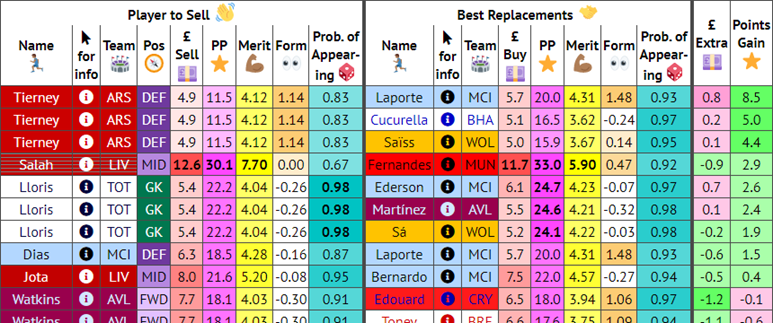
The table shows the top 3 affordable players (that you don't own) to replace each of the players in your squad.
Double FPL Transfer Suggestor:
The table shows up to the top 3 affordable pairs of players (that you don't own) to replace every pair of players in your squad.

Players to sell are on the left. Players to buy to replace them with are on the right. The most profitable transfers, in terms of predicted FPL points, are shown at the top. Here are descriptions of the less obvious columns:
- for info - Click the symbol in a player's row to launch a big popup window containing detailed information about that player. See Player Information Popups below.
- £ Sell - Your selling price for the player, which will vary depending on when you bought him.
- PP - The total FPL points that I predict the player will score for the range of gameweeks you specified.
- Single Transfer Suggestor Only (more info on these in the FPL Player Predicted Points (PP) and Value section):
- Merit - This is my measure of how good a player currently is, in terms of their likelihood to score FPL points.
- Form - This is a measure of whether a player has under or over-performed (i.e. scored more or fewer FPL points) over his last 4 fixtures, compared to my predictions for that player.
- Prob. Of Appearing - The player's probability of playing at all (not just starting) in the next fixture, based on how often he appeared in the recent past when available to play.
- £ Buy - The current price to buy the player. Prices change each night (UK time). FPL Form updates every hour.
- £ Extra - The is extra amount of money it will cost you to make the transfer(s). If you save money, the figure will be negative and shaded green.
- Points Gain - The number of FPL points that I predict you will gain over the range of gameweeks you specified, by making the transfer(s). Predicted gains are shown in green. Losses in pink.
Player Information Popups
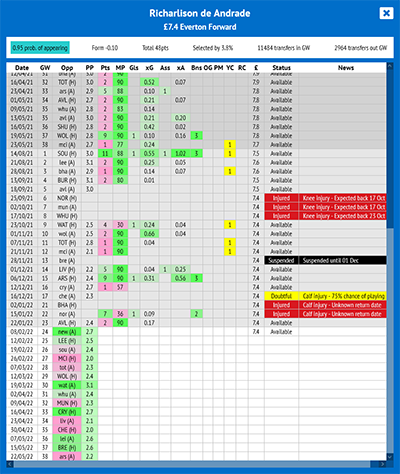 Click the symbol for a player in either the FPL Player Predicted Points (PP) and Value page or my transfer suggestors to launch a big popup window containing detailed information about that player.
Top Info Panel
If the player is flagged for any reason, this will be displayed in a banner at the top of the popup window. Below that, the top info panel displays the following information:
- Probability of appearing - The player's probability (between 0 and 1) of playing at all (not just starting) in the next fixture.
- Form - A measure of how many FPL points the player has scored over his last 4 fixtures, compared to my predictions for him. Not the same as FPL's own "form".
- Total Points - Total FPL points scored so far this season.
- Selected by - The percentage of FPL managers who own the player.
- Transfers in GW - The number of times the player has been transferred in during the current gameweek.
- Transfers out GW - The number of times the player has been transferred out during the current gameweek.
Gameweeks Panel
The table of gameweeks makes it easy to analyse a player's statistics, fixture difficulty and points predictions at a glance. Future gameweeks are white . This season's gameweeks whose transfer deadline has passed are pale grey . Last season's gameweeks, if any, are darker grey .
In general, pink is bad, green is good, and grey is neutral.
The meaning of most of the table's columns are shown in tooltips when you hover over their headers. Here's a list of the meanings of the columns:
- GW - FPL gameweek number. Fixtures in multiple gameweeks are shown separately.
- Opp - Opposition. Upper case = at home. Lower case = away. Easier opponents, for players in this player's position, are green . More difficult opponents, for players in this player's position, are pink .
- PP - Predicted FPL points (sometimes known as "xP"). Note that my algorithm is continuously improving, so older predictions were not as accurate, on average, as recent and future predictions.
- Pts - Actual FPL points scored.
- MP - Minutes played.
- Svs (goalkeepers only) - Saves.
- PS (goalkeepers only) - Penalties saved.
- Gls - Goals scored.
- xG (outfield players only) - Expected goals.
- Ass - Assists.
- xA (outfield players only) - Expected assists.
- GC - Goals conceded.
- Bns - Bonus points.
- OG - Own goals.
- PM - Penalties missed.
- YC - Yellow cards.
- RC - Red cards.
- ddd - The cost of the player before that gameweek transfer deadline.
- Status - Available, Doubtful, Injured, Suspended, Unavailable or Ineligible.
- News - FPL official news about the player. Usually this concerns availability issues such as injuries, suspensions, transfers and loans.
Season Tickers
The site has 5 more season tickers to help you with planning your FPL transfers and team selections.
On all these tickers, the column headers of blank gameweeks, where 2 or more teams have no fixture, are shaded cyan . The column headers of double gameweeks, where 2 or more teams have 2 fixtures, are shaded lilac .
Cells are shaded dark grey in these circumstances:
- Gameweeks with transfer deadlines in the past.
- Gameweeks where a team blanks (has no fixtures).
- The 2nd cell in a gameweek where other teams have 2 fixtures but this team only has 1.
Predicted Team Goals
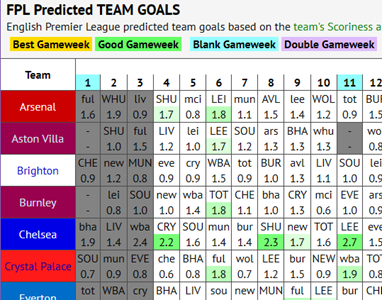
This table show predicted team goals for each gameweek based on the team's Scoriness and opposition's Porosity metrics.
It is particularly useful for spotting opportunities to play your triple captain chip. The deeper green, the more goals the team is predicted to score. The predicted highest scoring fixtures are colored gold , and are either in double gameweeks or when the scoriest teams meet the leakiest opposition. Of course, outstanding team performance does not necessarily translate to a monster haul for any individual player, and you'd still want to consult the predicted FPL points table, but this table gives an at-a-glance overview of which teams and gameweeks to target.
Fixture Difficulty
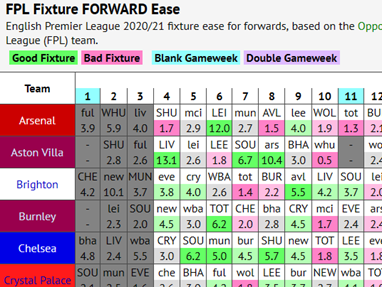
These 4 tables show the difficulty of future fixtures by FPL player position, to help you with transfer strategy:
- Fixture Difficulty for goalkeepers...
- Fixture Difficulty for defenders...
- Fixture Difficulty for midfielders...
- Fixture Difficulty for forwards...
The fixture difficulty is calculated on the basis of an optimized mix of these metrics (that you can see on my FPL Fixture Difficulty page):
- Opposition [POSITION] FPL-Pointiness - This is a measure of past FPL points conceded by the opposition team to players in that FPL position. This is an excellent predictor of team vulnerability to specific positions. I have seen similar metrics referred to as FPA (standing for FPL Points Against).
- Scoriness - This is a measure of the opposition team's likelihood to score goals, based on past goals scored and team xG (expected goals). This is used in the goalkeeper and defender calculations.
- Porosity - This is a measure of the opposition team's likelihood to concede goals, based on past goals conceded and team xGA (expected goals against). This is used in the midfielder and forward calculations.
In each case, recent past performance is given more weighting than older past performance.
Some of the ratings can be quite surprising, and in conflict with general conceptions about teams' strengths, but my optimization has shown this metric to be generally a slightly more reliable predictor of future FPL points than goals scored/conceded or team xG/xGA.
Easier fixtures are colored green. More difficult fixtures are colored pink. Neutral fixtures are colored pale grey. Favorable runs of fixtures can be spotted by generally green sequences, while poor runs of fixtures can be spotted by generally pink sequences.
FPL Player Data
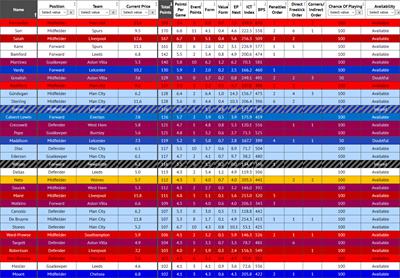
This is simply a table of player data taken from the Fantasy Premier League API.
Unfortunately the cells from the table header and left column often do not line up correctly with the cells in the table. This is a side-effect of having both the left column and table header fixed. Refreshing the page can sometimes correct it.
Most of the columns are self-explanatory. Some of them are duplications of the columns shown in the Predicted Points table, and much of this information can be seen on the FPL website, along with explanations of their meaning. However some other useful information is hidden in the FPL API and presented in these columns:
- EP Next - This is the FPL's own Expect Points prediction. I don't know how they are calculated, but are worth comparing with my own Predicted Points (PP) for the next gameweek.
- Penalties Order - This is the order of preference for which player takes penalties. This is important to know, especially with the utterly ridiculous number of soft or incorrect penalties that are awarded these days. The player most likely to take penalties has a rating of 1, however it does not take into account the player's probability of playing, so for example Milner has a rating of 1 but Salah, who is more likely to be on the pitch, has a rating of 2.
- Direct Freekick Order - The order of preference for which player takes direct freekicks. e.g. Ward-Prowse and Trent Alexander-Arnold are most likely to take direct freekicks for their teams so they have a rating of 1.
- Corner/Indirect Order - The order of preference for which player takes corners and indirect freekicks.
By default, the table is sorted primarily by Total Points this season, and secondarily by the player's name. To sort by other columns, click the column header once or twice.
FPL Form on Mobile
By its "big tables" nature, most of the FPL Form website is easier to use on a desktop computer or other device with a large display. It is possible to use on mobile devices, but it is not easy. It helps if you are already familiar with how the site works on a larger display. Below are a couple of tips to help you.
Disable Zoom (Chrome on Android)
Chrome on Android has a feature that enables zooming on all sites by default, for accessibility purposes, regardless of the site's setting. Unfortunately this breaks the functionality of my pages that feature interactive tables, such as FPL Player Predicted Points (PP) and Value and my FPL Manager Ranking, for which zooming must be disabled on mobile devices. To disable zooming:
- Open the Chrome menu using the 3 dots at the top right.
- Choose "Settings".
- Choose "Accessibility".
- Uncheck "Force enable zoom".
Clear Mobile Browser Cache
If things go weird (e.g. a page hangs during load) it can help to clear the browser cache and reload the site. Unfortunately it is a bit more difficult than doing CTRL+F5 on desktop, and I could not find a method to clear the cache for just one site. I only tested on Chrome and Firefox for Android, but these settings may also apply to the same browsers on other operating systems.
Chrome (Android)
- Open the Chrome menu using the 3 dots at the top right.
- Choose "Settings".
- Choose "Privacy and security".
- Choose "Delete browsing data".
- Check "Cached images and files".
- Press "Delete data".
Firefox (Android)
- Open the Firefox menu using the 3 dots at the lower right.
- Choose "Settings".
- Choose "Delete browsing data".
- Check "Cached images and files" and "Open tabs".
- Press "Delete browsing data" and confirm "DELETE".
